Note
Go to the end to download the full example as a Python script or as a Jupyter notebook..
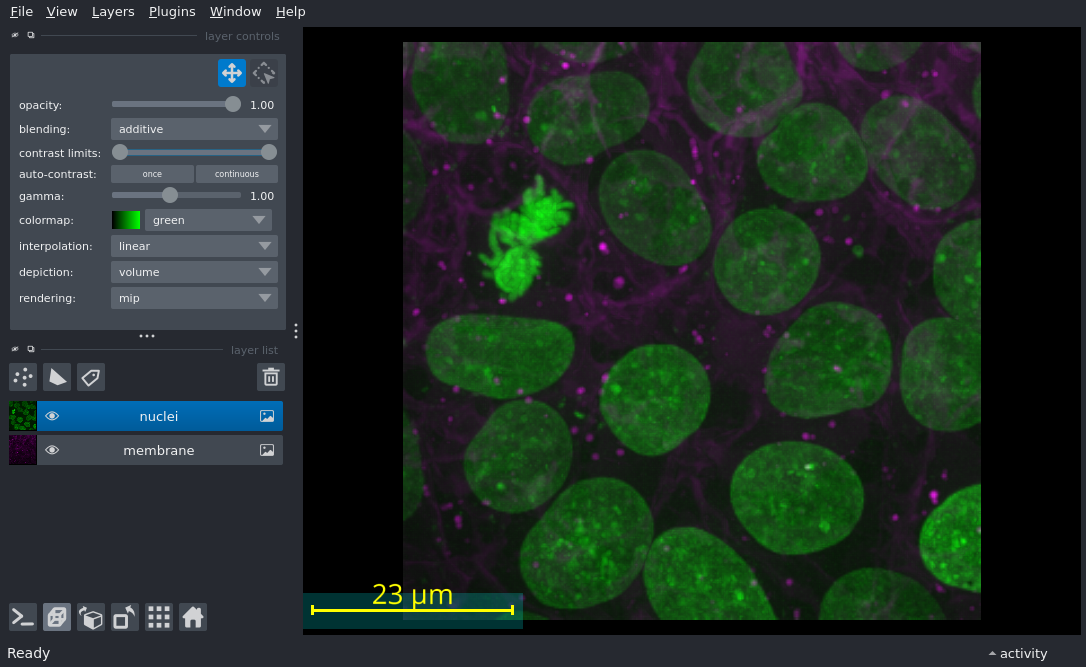
Scale bar#
Display a 3D volume and the scale bar
from skimage import data

import napari

cells = data.cells3d()

viewer = napari.Viewer(ndisplay=3)

viewer.add_image(
    cells,
    name=('membrane', 'nuclei'),
    channel_axis=1,
    scale=(0.29, 0.26, 0.26),
)
viewer.scale_bar.visible = True

# Text options
viewer.scale_bar.unit = 'um'  # set to None to diplay no unit
viewer.scale_bar.length = 23  # length, in units, of the scale bar
viewer.scale_bar.font_size = 20  # default is 10

# Text color
viewer.scale_bar.colored = True  # default value is False
viewer.scale_bar.color = 'yellow'  # default value is magenta: (1,0,1,1)

# Background box
viewer.scale_bar.box = True  # add background box, default is False
viewer.scale_bar.box_color = (0, 1, 1, 0.2)  # cyan with alpha=0.2

# Scale bar position
viewer.scale_bar.position = 'bottom_left'  # default is 'bottom_right'

if __name__ == '__main__':
    napari.run()