Vectors#
In this document, you will learn about the napari vectors layer, including
how to display many vectors simultaneously and adjust their properties.
For more information about layers, refer to Layers at a glance.
Note
Vector layers can be added only programmatically, i.e., in the console, or using a script, not from the GUI. Please refer to A simple example and use the code there to add a vectors layer first, then explore the GUI controls.
When to use the vectors layer#
The vectors layer allows you to display many vectors with defined starting
points and directions. It is particularly useful for people who want to
visualize large vector fields, for example if you are doing polarization
microscopy. You can adjust the color, width, and length of all the vectors from
the console or from the GUI.
A simple example#
You can create a new viewer with napari.Viewer() and add vectors using the
add_vectors() method.
In these examples we’ll mainly use add_vectors to overlay vectors onto an existing image.
In this example, we will overlay vectors on the image of a photographer:
import napari
import numpy as np
from skimage import data

# create vector data
n = 250
vectors = np.zeros((n, 2, 2), dtype=np.float32)
phi_space = np.linspace(0, 4 * np.pi, n)
radius_space = np.linspace(0, 100, n)
# assign x-y projection
vectors[:, 1, 0] = radius_space * np.cos(phi_space)
vectors[:, 1, 1] = radius_space * np.sin(phi_space)
# assign x-y position
vectors[:, 0] = vectors[:, 1] + 256

# add the image
viewer, _ = napari.imshow(data.camera(), name='photographer')
# add the vectors
vectors_layer = viewer.add_vectors(vectors, edge_width=3)
/home/runner/work/docs/docs/.venv/lib/python3.12/site-packages/tqdm/auto.py:21: TqdmWarning: IProgress not found. Please update jupyter and ipywidgets. See https://ipywidgets.readthedocs.io/en/stable/user_install.html
  from .autonotebook import tqdm as notebook_tqdm

Using the GUI to manipulate vectors#
Before you can use the GUI to manipulate vectors, you must load a vector layer.
Please refer to A simple example to add a vectors layer
first, then explore the editing options the GUI provides.
Buttons
Pan/zoom -
 is the default
mode of the layer and supports panning and zooming. Press the
is the default
mode of the layer and supports panning and zooming. Press the 1key when the layer is selected to use this mode.Transform -
 enables you to
rotate, scale, or translate the layer. Note: at present this feature is limited to 2D viewer display mode. To reset the transformation, you can
Option/Alt-click the transform button (a confirmation dialog will open to
confirm the reset). Press the
enables you to
rotate, scale, or translate the layer. Note: at present this feature is limited to 2D viewer display mode. To reset the transformation, you can
Option/Alt-click the transform button (a confirmation dialog will open to
confirm the reset). Press the 2key when the layer is selected to use this mode.
Controls
Opacity - click and hold the circle on the opacity slider bar and adjust it to any value between 0.00 (clear) and 1.00 (completely opaque).
Width - adjusting the width makes the vectors appear thicker or thinner. Use the + and - buttons on either side of the width bar to adjust width or click on the number in the middle of the bar and enter a value. The minimum value is 0.10.
Length - adjusting the length makes the vector longer or shorter. Use the + and - buttons on either side of the length bar to adjust length or click on the number in the middle of the bar and enter a value. The minimum value is 0.10.
Blending -
blendinghas the options ofopaque,translucent,translucent no depth,minimum, oradditivein the dropdown. Refer to the Blending layers section of Layers at a glance for an explanation of each type of blending.Edge color mode - select
direct,cycle, orcolormapfrom the dropdown.Direct (default mode) allows each vector to be set arbitrarily.
Cycle allows the color to be set via a color cycle over an attribute.
Colormap allows the color to be set via a color map over an attribute.
Edge color - click the thumbnail next to
edge color:to select or create a color from the palette.Out of slice - if this box is checked,
out of sliceis on or true. If this box is not checked,out of sliceis off or false. If it is on or true, vectors slightly out of slice are rendered.
Vector starting position#
The starting position of vectors cannot be edited from the GUI. Nor is it
possible to draw vectors from the GUI. If you want to draw lines using the GUI
you should use the Lines shape inside a shapes layer.
3D rendering#
All layers can be rendered in both 2D and 3D. One of the viewer buttons at the
bottom of the left panel can toggle between these 2 modes.
When in 2D, the button looks like this:  , ready to switch to 3D mode.
When in 3D, the button looks like this:
, ready to switch to 3D mode.
When in 3D, the button looks like this:  , ready to switch to 2D mode.
The number of dimensions sliders will be 2 or 3 less than the total number of dimensions of the layer, allowing you to browse volumetric timeseries data and other high dimensional data. See nD vectors to see shapes in both 2D and 3D:
Arguments of add_vectors#
add_vectors() accepts the following layer-creation parameters.
help(napari.Viewer.add_vectors)
Changing vector length, width, and color#
Scale the length of all the vectors on a layer using the layer.length property.
Set the width of all the vectors in a layer using the layer.width property.
Set the color of all the vectors in a layer using the layer.edge_color property.
Vectors data#
The input data to the vectors layer must be an Nx2xD NumPy array
representing N vectors with start position and projection values in D
dimensions, or it must be an N1xN2 ... xNDxD array where each of the first
D dimensions corresponds to the voxel of the location of the vector, and the
last dimension contains the D values of the projection of that vector. The
former representation is useful when you have vectors that can start in
arbitrary positions in the canvas. The latter representation is useful when your
vectors are defined on a grid, say corresponding to the voxels of an image, and
you have one vector per grid.
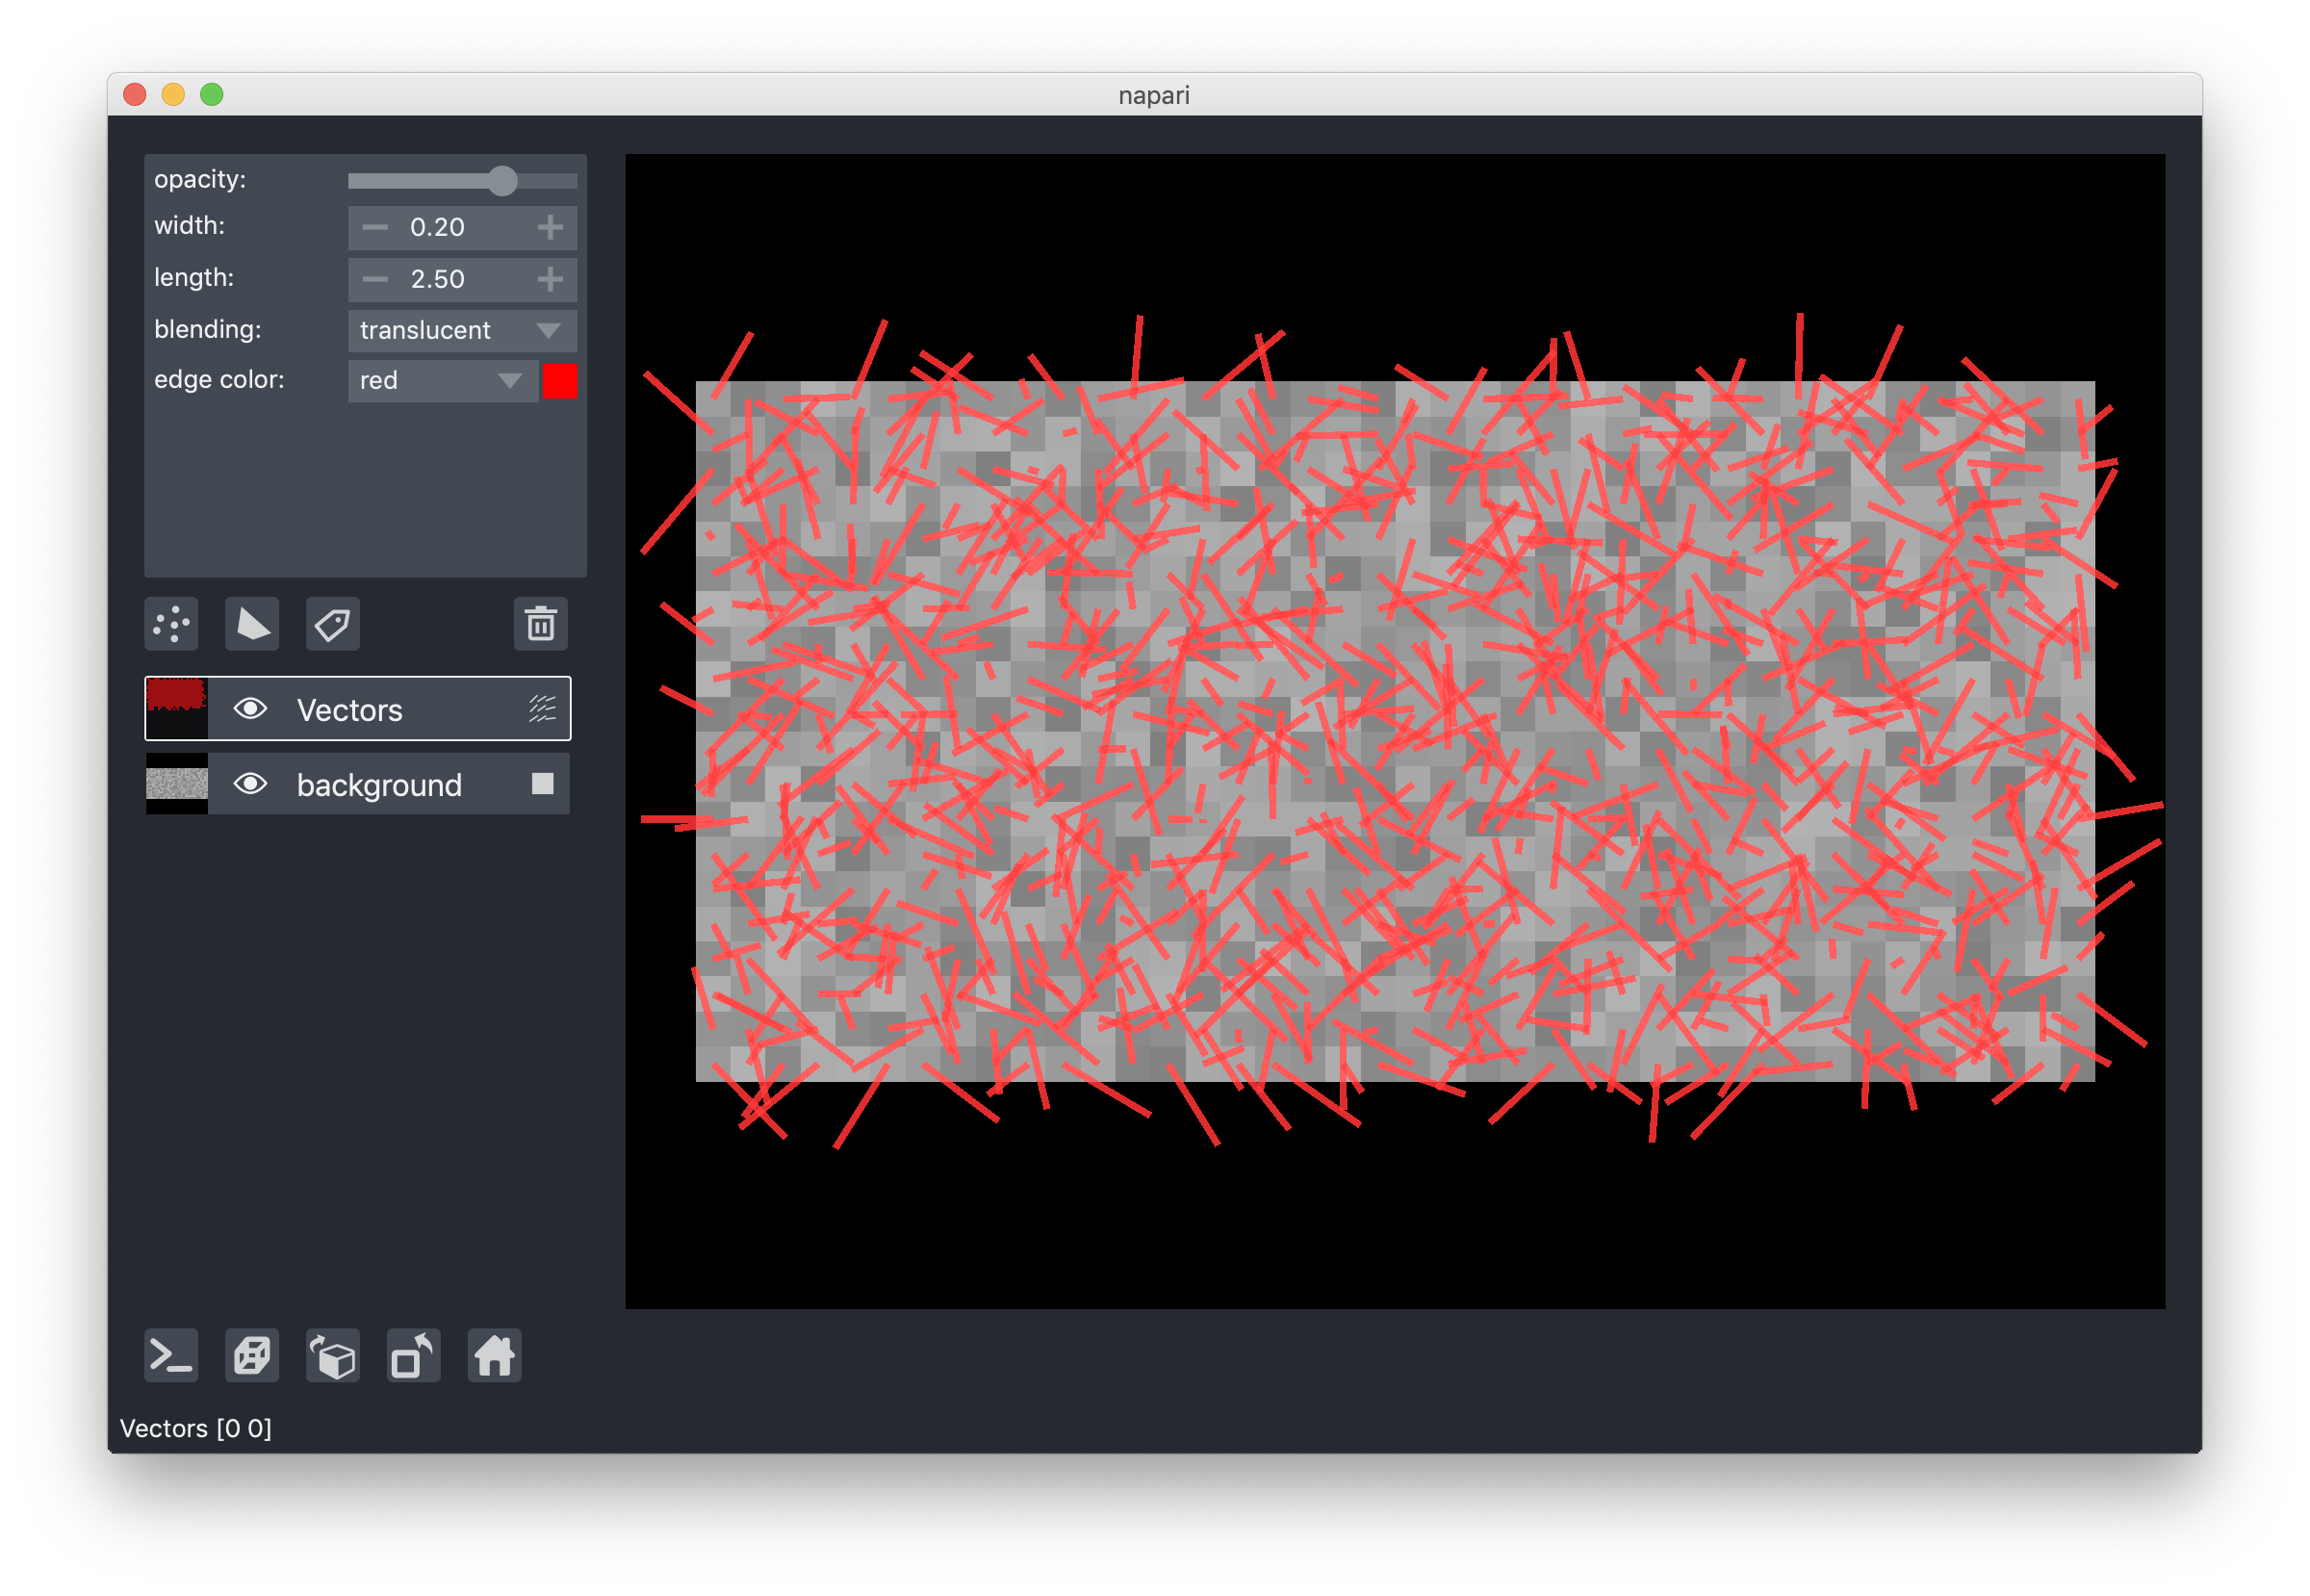
Here is an example from Add vectors image of a grid of vectors defined over a random image:
Regardless of how the data is passed, we convert it to the Nx2xD
representation internally. This representation is accessible through the
layer.data property.